Electrify Chicago
According to the
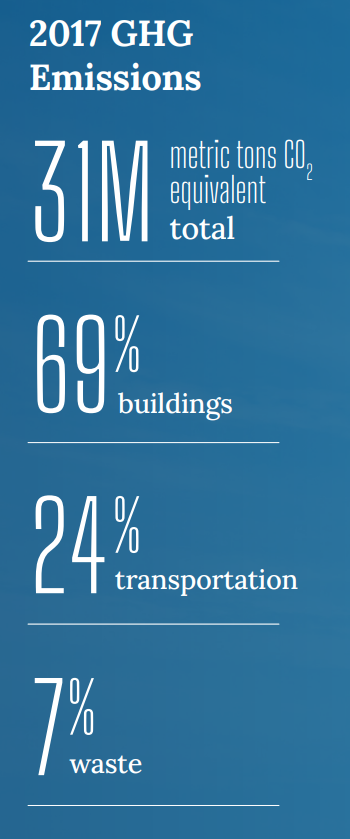
2022 Chicago Climate Action Plan ,
a whopping 69% of Chicago's emissions come from buildings, making it
our biggest challenge and our biggest opportunity as a city to tackle
change. At Electrify Chicago we want to showcase some of the best and worst performing
buildings in the city using publicly available data and manual annotations to add
building photographs and label multi-building owners like universities.
,
a whopping 69% of Chicago's emissions come from buildings, making it
our biggest challenge and our biggest opportunity as a city to tackle
change. At Electrify Chicago we want to showcase some of the best and worst performing
buildings in the city using publicly available data and manual annotations to add
building photographs and label multi-building owners like universities.
You can start by looking at Chicago's buildings with the highest greenhouse gas intensity - this means that they use the most energy when adjusted per unit of square foot, so big buildings could actually perform much better than very inefficient small buildings on this metric.
Chicago Buildings by Greenhouse Gas Intensity
Note: Data only includes large Chicago buildings from 2020
Note: This data only includes buildings whose emissions are reported
under the
Chicago Energy Benchmarking Ordinance. According to the City “As of 2016,
this list includes all commercial, institutional, and residential buildings larger than
50,000 square feet.” This dataset is also then filtered to only buildings with
reported emissions > 1,000 metric tons CO2 equivalent.
This data is also from 2020, but when new benchmark data is available, we'll update the site.
| Property Name / address | Primary Property Type |
Greenhouse Gas Intensity (kg CO2 eq./sqft) |
Total Greenhouse Emissions (metric tons CO2 eq.) |
|---|---|---|---|
|
Woodlawn Terrace
4724 4730 S WOODLAWN AVE
| Multifamily Housing | 6.5 kg/sqft
Highest 49%
| 381 tons
Lowest 16%
|
|
The Wrigley Building
410 N MICHIGAN AVE
| Office | 6.5 kg/sqft
Highest 49%
| 4,037 tons
Highest 9%
|
|
Randolph Wells
205 W Randolph St
| Office | 6.5 kg/sqft
Highest 49%
| 1,299 tons
Highest 36%
|
|
200 West Monroe
200 W Monroe
| Office | 6.5 kg/sqft
Highest 49%
| 4,583 tons
Highest 8%
|
|
Renelle on the River
403 N Wabash
| Multifamily Housing | 6.4 kg/sqft
Lowest 49%
| 864 tons
Lowest 50%
|
|
MRR 619 S LaSalle LLC
619 S LaSalle
| Multifamily Housing | 6.4 kg/sqft
Lowest 49%
| 608 tons
Lowest 35%
|
|
1117-37 W Monroe
1117-1137 W Monroe
| Multifamily Housing | 6.4 kg/sqft
Lowest 49%
| 384 tons
Lowest 16%
|
|
The Van Buren _CO (th202)
808 W Van Buren
| Multifamily Housing | 6.4 kg/sqft
Lowest 49%
| 748 tons
Lowest 44%
|
|
MiCA
2733 W BELDEN AVE
| Multifamily Housing | 6.4 kg/sqft
Lowest 49%
| 1,320 tons
Highest 35%
|
|
247-Senior Suites of Norwood Park
5700 North Harlem Avenue
| Senior Living Community | 6.4 kg/sqft
Lowest 49%
| 596 tons
Lowest 35%
|
|
7150 Cyril Court Apartments
7150 S Cyril Ct
| Multifamily Housing | 6.4 kg/sqft
Lowest 49%
| 473 tons
Lowest 25%
|
|
Lavergne Court Apts.
4938 W Quincy St
| Multifamily Housing | 6.4 kg/sqft
Lowest 49%
| 919 tons
Highest 48%
|
|
Social Science Research Building
1126 E 59th St
| College/University | 6.4 kg/sqft
Lowest 49%
| 452 tons
Lowest 22%
|
|
James B McPherson Elementary School
(CPS)
4728 N Wolcott Ave
| K-12 School | 6.4 kg/sqft
Lowest 49%
| 998 tons
Highest 45%
|
|
Edward Beasley Elementary Magnet Academic Center
(CPS)
5235 S State St
| K-12 School | 6.4 kg/sqft
Lowest 49%
| 996 tons
Highest 45%
|
Data Source:
Chicago Energy Benchmarking Data