Electrify Chicago
According to the
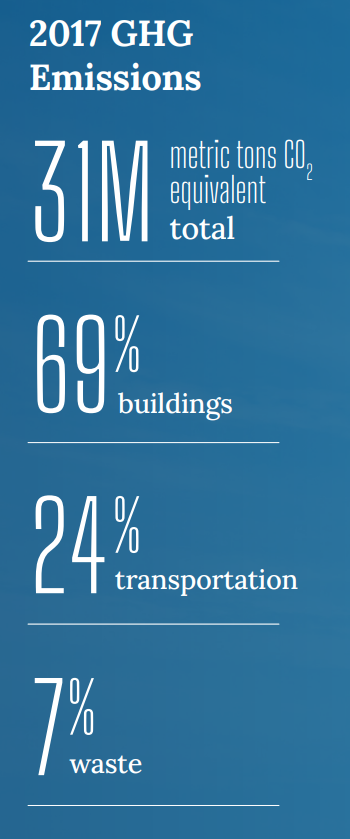
2022 Chicago Climate Action Plan ,
a whopping 69% of Chicago's emissions come from buildings, making it
our biggest challenge and our biggest opportunity as a city to tackle
change. At Electrify Chicago we want to showcase some of the best and worst performing
buildings in the city using publicly available data and manual annotations to add
building photographs and label multi-building owners like universities.
,
a whopping 69% of Chicago's emissions come from buildings, making it
our biggest challenge and our biggest opportunity as a city to tackle
change. At Electrify Chicago we want to showcase some of the best and worst performing
buildings in the city using publicly available data and manual annotations to add
building photographs and label multi-building owners like universities.
You can start by looking at Chicago's buildings with the highest greenhouse gas intensity - this means that they use the most energy when adjusted per unit of square foot, so big buildings could actually perform much better than very inefficient small buildings on this metric.
Chicago Buildings by Greenhouse Gas Intensity
Note: Data only includes large Chicago buildings from 2020
Note: This data only includes buildings whose emissions are reported
under the
Chicago Energy Benchmarking Ordinance. According to the City “As of 2016,
this list includes all commercial, institutional, and residential buildings larger than
50,000 square feet.” This dataset is also then filtered to only buildings with
reported emissions > 1,000 metric tons CO2 equivalent.
This data is also from 2020, but when new benchmark data is available, we'll update the site.
| Property Name / address | Primary Property Type |
Greenhouse Gas Intensity (kg CO2 eq./sqft) |
Total Greenhouse Emissions (metric tons CO2 eq.) |
|---|---|---|---|
|
70800789 -- 47th ~ Damen
4620 S Damen Ave
| Supermarket/Grocery Store | 20.8 kg/sqft
Highest 3%
| 1,590 tons
Highest 29%
|
|
202
2200 S Western Ave
| Supermarket/Grocery Store | 20.4 kg/sqft
Highest 4%
| 1,328 tons
Highest 35%
|
|
1440 N Dayton Street
1440 N Dayton Street
| Office | 20.3 kg/sqft
Highest 4%
| 1,326 tons
Highest 35%
|
|
Institute of Forensic Medicine
2121 W Harrison St
| Other - Public Services | 20.3 kg/sqft
Highest 4%
| 1,608 tons
Highest 29%
|
|
Costco #0380 Lincoln Park
2746 N Clybourn Ave
| Supermarket/Grocery Store | 20.3 kg/sqft
Highest 4%
| 2,895 tons
Highest 14%
|
|
Gateway Centre 176022 Building B or 2 (Jewel)
7451 7521 N CLARK ST
| Retail Store | 20.1 kg/sqft
Highest 4%
| 1,570 tons
Highest 30%
|
|
216 West Jackson LLC
216 W Jackson Blvd
| Office | 19.9 kg/sqft
Highest 4%
| 3,630 tons
Highest 10%
|
|
03442- Chicago, IL
4042 W Foster Ave
| Supermarket/Grocery Store | 19.9 kg/sqft
Highest 4%
| 1,295 tons
Highest 36%
|
|
01296- Chicago, IL
7342 W Foster Ave
| Supermarket/Grocery Store | 19.8 kg/sqft
Highest 4%
| 1,532 tons
Highest 31%
|
|
Ascension Resurrection Medical Center Campus.
🚨
7435 W Talcott Ave
| Hospital (General Medical & Surgical) | 19.8 kg/sqft
Highest 4%
| 21,667 tons #12 Highest
|
|
Physics Research Center (PRC)
933 E 56th Street
| Laboratory | 19.6 kg/sqft
Highest 4%
| 1,315 tons
Highest 36%
|
|
Kent Chemical Laboratory
1020 - 1024 E 58th St
| Laboratory | 19.5 kg/sqft
Highest 4%
| 1,165 tons
Highest 39%
|
|
Bria of Forest Edge
8001 S Western Ave
| Senior Living Community | 19.5 kg/sqft
Highest 4%
| 1,420 tons
Highest 33%
|
|
03477- Chicago, IL
4734 N Cumberland Ave
| Supermarket/Grocery Store | 19.5 kg/sqft
Highest 4%
| 1,027 tons
Highest 44%
|
|
East Bank Club
500 N Kingsbury St
| Fitness Center/Health Club/Gym | 19.5 kg/sqft
Highest 4%
| 5,905 tons
Highest 5%
|
Data Source:
Chicago Energy Benchmarking Data