Electrify Chicago
According to the
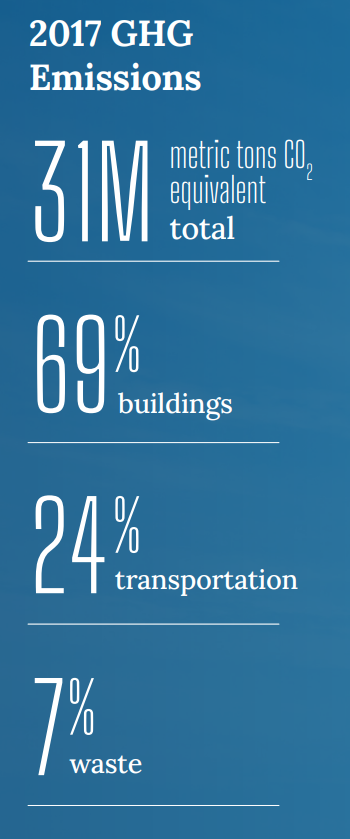
2022 Chicago Climate Action Plan ,
a whopping 69% of Chicago's emissions come from buildings, making it
our biggest challenge and our biggest opportunity as a city to tackle
change. At Electrify Chicago we want to showcase some of the best and worst performing
buildings in the city using publicly available data and manual annotations to add
building photographs and label multi-building owners like universities.
,
a whopping 69% of Chicago's emissions come from buildings, making it
our biggest challenge and our biggest opportunity as a city to tackle
change. At Electrify Chicago we want to showcase some of the best and worst performing
buildings in the city using publicly available data and manual annotations to add
building photographs and label multi-building owners like universities.
You can start by looking at Chicago's buildings with the highest greenhouse gas intensity - this means that they use the most energy when adjusted per unit of square foot, so big buildings could actually perform much better than very inefficient small buildings on this metric.
Chicago Buildings by Greenhouse Gas Intensity
Note: Data only includes large Chicago buildings from 2020
Note: This data only includes buildings whose emissions are reported
under the
Chicago Energy Benchmarking Ordinance. According to the City “As of 2016,
this list includes all commercial, institutional, and residential buildings larger than
50,000 square feet.” This dataset is also then filtered to only buildings with
reported emissions > 1,000 metric tons CO2 equivalent.
This data is also from 2020, but when new benchmark data is available, we'll update the site.
| Property Name / address | Primary Property Type |
Greenhouse Gas Intensity (kg CO2 eq./sqft) |
Total Greenhouse Emissions (metric tons CO2 eq.) |
|---|---|---|---|
|
The Pinnacle Condo
21 E Huron St
| Multifamily Housing | 8.2 kg/sqft
Highest 25%
| 4,987 tons
Highest 7%
|
|
One Place Condominium Association
1 E 8th St
| Multifamily Housing | 8.2 kg/sqft
Highest 25%
| 2,566 tons
Highest 16%
|
|
Onni Atrium Apartments, LP
303 W Division St
| Multifamily Housing | 8.2 kg/sqft
Highest 25%
| 1,178 tons
Highest 39%
|
|
Grand Plaza
🚩
540 N State St
| Multifamily Housing | 8.2 kg/sqft
Highest 25%
| 9,123 tons
Highest 3%
|
|
West Point Plaza Venture LLLP
300 S DAMEN AVE
| Multifamily Housing | 8.2 kg/sqft
Highest 25%
| 1,412 tons
Highest 33%
|
|
Howard & Western Shopping Center
7510 - 7578 N Western Ave
| Strip Mall | 8.2 kg/sqft
Highest 25%
| 567 tons
Lowest 32%
|
|
CHICAGO BRICKYARD (1924)
6525 W Diversey Ave
| Retail Store | 8.2 kg/sqft
Highest 25%
| 1,150 tons
Highest 40%
|
|
1237 Fullerton LLC dba Ion Lincoln Park
1237 W Fullerton Ave
| Multifamily Housing | 8.2 kg/sqft
Highest 25%
| 1,815 tons
Highest 26%
|
|
161 North Clark
🚩
161 N Clark
| Office | 8.2 kg/sqft
Highest 25%
| 9,813 tons
Highest 3%
|
|
100 North Riverside Plaza
100 N Riverside Plz
| Office | 8.2 kg/sqft
Highest 25%
| 7,138 tons
Highest 4%
|
|
Algonquin #4
1607 E 50TH PL
| Multifamily Housing | 8.2 kg/sqft
Highest 25%
| 487 tons
Lowest 26%
|
|
Algonquin #5
1617 E 50TH PL
| Multifamily Housing | 8.1 kg/sqft
Highest 26%
| 479 tons
Lowest 25%
|
|
THC 1333 S. Wabash LLC
1333 S WABASH AVE
| Multifamily Housing | 8.1 kg/sqft
Highest 26%
| 2,167 tons
Highest 20%
|
|
Wicker Park Connection
1664 W Division St
| Multifamily Housing | 8.1 kg/sqft
Highest 26%
| 569 tons
Lowest 33%
|
|
Northwest Tower
1170 W Erie St
| Multifamily Housing | 8.1 kg/sqft
Highest 26%
| 1,134 tons
Highest 40%
|
Data Source:
Chicago Energy Benchmarking Data