Electrify Chicago
According to the
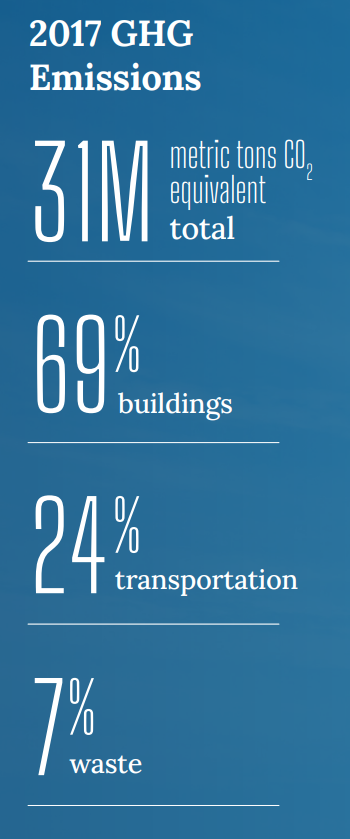
2022 Chicago Climate Action Plan ,
a whopping 69% of Chicago's emissions come from buildings, making it
our biggest challenge and our biggest opportunity as a city to tackle
change. At Electrify Chicago we want to showcase some of the best and worst performing
buildings in the city using publicly available data and manual annotations to add
building photographs and label multi-building owners like universities.
,
a whopping 69% of Chicago's emissions come from buildings, making it
our biggest challenge and our biggest opportunity as a city to tackle
change. At Electrify Chicago we want to showcase some of the best and worst performing
buildings in the city using publicly available data and manual annotations to add
building photographs and label multi-building owners like universities.
You can start by looking at Chicago's buildings with the highest greenhouse gas intensity - this means that they use the most energy when adjusted per unit of square foot, so big buildings could actually perform much better than very inefficient small buildings on this metric.
Chicago Buildings by Greenhouse Gas Intensity
Note: Data only includes large Chicago buildings from 2020
Note: This data only includes buildings whose emissions are reported
under the
Chicago Energy Benchmarking Ordinance. According to the City “As of 2016,
this list includes all commercial, institutional, and residential buildings larger than
50,000 square feet.” This dataset is also then filtered to only buildings with
reported emissions > 1,000 metric tons CO2 equivalent.
This data is also from 2020, but when new benchmark data is available, we'll update the site.
| Property Name / address | Primary Property Type |
Greenhouse Gas Intensity (kg CO2 eq./sqft) |
Total Greenhouse Emissions (metric tons CO2 eq.) |
|---|---|---|---|
|
Park Lincoln By Reside
2470 N Clark St
| Multifamily Housing | 5.2 kg/sqft
Lowest 27%
| 780 tons
Lowest 46%
|
|
1120 N Lake Shore Drive
1120 N Lake Shore Dr
| Multifamily Housing | 5.2 kg/sqft
Lowest 27%
| 712 tons
Lowest 42%
|
|
231 South LaSalle
231 S LaSalle St
| Office | 5.2 kg/sqft
Lowest 27%
| 6,132 tons
Highest 5%
|
|
Malibu Condominium
6007 N Sheridan Rd
| Multifamily Housing | 5.2 kg/sqft
Lowest 27%
| 2,658 tons
Highest 16%
|
|
565 West Quincy Condo Association
565 W Quincy St
| Multifamily Housing | 5.2 kg/sqft
Lowest 27%
| 2,005 tons
Highest 23%
|
|
1700 East 56th Street
1700 E 56th St
| Multifamily Housing | 5.2 kg/sqft
Lowest 27%
| 2,462 tons
Highest 17%
|
|
Venetian Condominium Association
222 232 W DIVISION ST
| Multifamily Housing | 5.2 kg/sqft
Lowest 27%
| 1,150 tons
Highest 40%
|
|
Condos at Monroe Place
1228 W MONROE
| Multifamily Housing | 5.2 kg/sqft
Lowest 27%
| 270 tons
Lowest 7%
|
|
Lakeside Tower, LLC
910 W LAWRENCE AVE
| Multifamily Housing | 5.2 kg/sqft
Lowest 27%
| 473 tons
Lowest 25%
|
|
Hunter Properties, Inc. (2232 W. Farwell Ave.)
2232 W FARWELL AVE
| Multifamily Housing | 5.2 kg/sqft
Lowest 27%
| 264 tons
Lowest 6%
|
|
Polish Roman Catholic Union of America
984 N MILWAUKEE AVE
| Museum | 5.2 kg/sqft
Lowest 27%
| 275 tons
Lowest 7%
|
|
The Flamingo
5500 S SHORE DR
| Multifamily Housing | 5.2 kg/sqft
Lowest 27%
| 851 tons
Lowest 49%
|
|
The Denifer
5400 5406 N KENMORE AVE
| Multifamily Housing | 5.2 kg/sqft
Lowest 27%
| 426 tons
Lowest 20%
|
|
1338 West Argyle Street (wr80)
1338 1354 W ARGYLE ST
| Multifamily Housing | 5.2 kg/sqft
Lowest 27%
| 268 tons
Lowest 6%
|
|
St. Mary of Providence
4200 N Austin Ave
| Mixed Use Property | 5.2 kg/sqft
Lowest 27%
| 999 tons
Highest 45%
|
Data Source:
Chicago Energy Benchmarking Data